
Supercharge Your FP&A Variance
Periodic variance analysis has got to be one of the hardest jobs in Financial Planning and Analysis (FP&A). Every month you go out to the various operations teams and shared services leads and ask them why their forecast is not on budget or most recent forecast. The answers are almost always lacking in detail and you spend a great deal of time pulling teeth trying to get an explanation from people who don’t care and do not want to take the time to find out the real answers as they have already moved on to next month. In order to predict the future, you must learn from the past, therefore this dreaded task remains a staple of most FP&A teams.
To help alleviate this frustration, I try to do as much analysis of the numbers before ever reaching out to anyone for additional explanations. One of my favorites is price (cost)-volume-mix analysis (“PVM Analysis” or “PVM”). Its simplicity is ideal, comes back to the fundamental economic equation of price x quantity and provides a plethora of great information that allows an FP&A Analyst to ask more detailed questions and drive the variance analysis explanations. In addition, it is useful regardless of industry, product or service sold.
Accounting typically looks to provide solid revenue and variable expense numbers first, therefore a PVM Analysis can also be used within a flash report before the full accounting close, followed up by detailed variance analysis later in the month.
PVM – The Basics
Before you begin, you need to accumulate the necessary information for PVM, that is:
Actual and budgeted/forecasted volumes by division/product/segment/etc… or at a level within the organization that is reasonable and provides sufficient detail
Price and variable cost per unit/driver for each level that you identify above
From these four variables, you can calculate all the other needed numbers within the analysis. For my example, I have used the following number:

It is a good idea to tie any analysis that FP&A performs back to a financial statement, if possible. For PVM, all numbers should tie back to the income statement. Before beginning, an FP&A analyst should perform a reconciliation between the source system data that is accumulated and the appropriate income statement line item. For PVM, the income statement line items should be:
Total Company Revenue = the sum product of the actual volume and price per appropriate unit/driver per level
Total Variable Costs = the sum product of the actual volume and variable cost per appropriate unit/driver per level
Total Contribution Margin – the sum product of the actual volume and (price – variable cost) per appropriate unit/driver per level
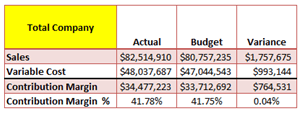
Using the numbers within the example above, the company’s total sales, variable cost and contribution margin can be calculated as follows.
Sales Variance Explanations
The first question that an FP&A Analyst should seek to answer is: Why are sales not as budgeted? There should always be a variance, if not, something is wrong. The FP&A Analysts can find out if sales differ from budget because of a variance in prices, volumes or the mix of products sold.
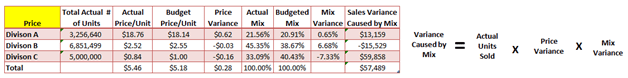
Sales Variance Caused by Price
Using the numbers given above in the example an FP&A Analyst can derive the following tables.

The FP&A Analyst can then compare total sales variance to the variance caused by Price. In this example, Actual sales exceeded Budget Sales by $1,757,675, of which $979,057 (or 56%), is due to higher prices. Analyzing the table further an FP&A Analyst can see that Division A was able to garner higher prices from its client during the period, which was partially offset by lower prices in Division B and C.
Sales Variance Caused by Volume and Mix
Volume and Mix are typically analyzed together as one offsets the other. Sales Volume can differ from budget for two reasons:
The mix of sales derived from each division is different than budgeted
Actual sales volume exceeded budgeted volumes
When calculating Sales Variance Caused by Volume, Sales Variance Caused by Mix is subtracted from the total.
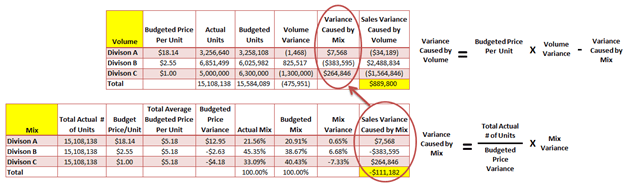
From the above table an FP&A Analyst can see that differences in the mix of sales caused lower overall sales, but this was more than offset by higher volumes, driven by sales from Division B.
Please note, I have seen several ways to calculate mix, and the one I used in the example above is simply an example. A popular alternative mix calculation would be as follows:
Bringing it all together, you can see that the sum of price, volume and mix equals total variance to budget.

The exact same methodology can be applied to explain variances in variable costs.

Total Company Analysis
Subtracting variable costs from Sales gets you contribution margin for each category. Putting that all together and you can create the following table:

Using this table and the supporting tables within this article, I can tell that sales exceeded budget by $1.8 million (2.18% of Budget), driven by higher prices in Division A and higher volumes in Division B. These higher volumes did not translate into the equivalent increase in contribution margin (CM only increased 0.09%[0.04%/41.75%]) because higher sales in Division A were offset by significantly higher variable costs per unit, while both Division B and C were able to hold variable costs in check.
One Step Further – Analyze By Division
An FP&A Analyst can take this one step further and analyze variances by division to see which was more profitable. Was it Division A, with higher total sales, Division B, who had higher total volumes or Division C who had lower volumes, but was able to keep variable costs down?

From the table above, you can see that Division B is the clear success story, although they had to cut prices to achieve higher volume they were able to lower their variable costs greater than the price decrease, driving higher contribution margin.
For FP&A Price-Volume-Mix Analysis is a Super-Charged Tool in the Finance Toolbox
An FP&A Analyst can use PVM analysis to pierce the fog of business and help senior management allocate resources to the division best able to manage resources to produce the most profit, which is what truly drives shareholder value.
Download my spreadsheet (here) with the tables and formulas in the article above and perform your own PVM Analysis at your company.